kubesphere 部署 promethues
PrometheusAlert+prometheus+Alertmanager实现各种类型告警 (企业微信告警、飞书告警、钉钉告警、)
https://blog.csdn.net/W1124824402/article/details/128846493、
prometheu是 有状态的 ,因为要保存 时序数据库
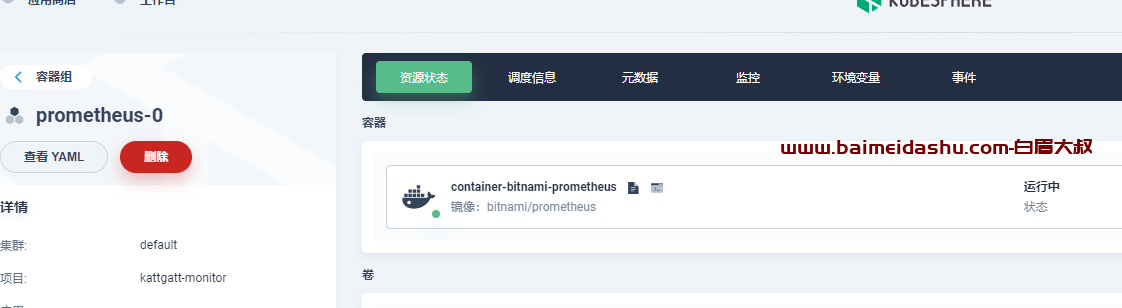
1- 镜像
bitnami/prometheus # 不能挂载数据,所以pass
prom/prometheus:v2.34.0可以把数据path 挂载 /prometheus
先不配置 存储卷和 字典,走低2步 第3步。
2- 配置 存储卷
prometheus-db
3- 配置 configmap -配置字典
prometheus-yml
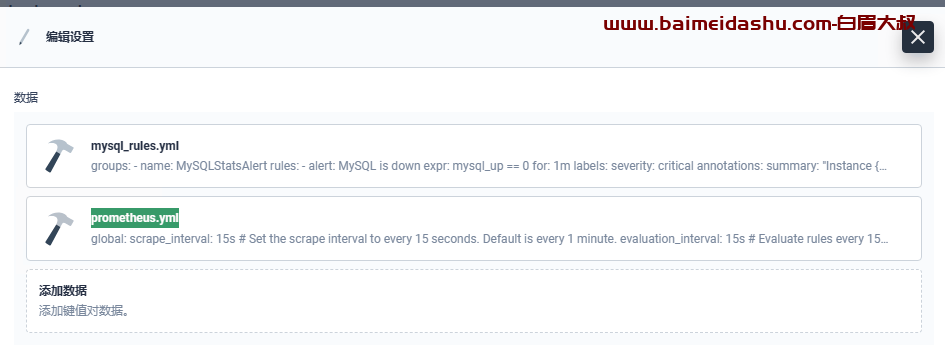
这里要注意, 因为镜像原因, 一些 其他 的 报警规则,我也写在这里边了。方便实用。
prometheus.yml 内容
global:
  scrape_interval: 15s # Set the scrape interval to every 15 seconds. Default is every 1 minute.
  evaluation_interval: 15s # Evaluate rules every 15 seconds. The default is every 1 minute.
  # scrape_timeout is set to the global default (10s).

# Alertmanager configuration
alerting:
  alertmanagers:
    - static_configs:
        - targets:
          # - alertmanager:9093
          - 10.0.0.201:31007

# Load rules once and periodically evaluate them according to the global 'evaluation_interval'.
rule_files:
  # - "first_rules.yml"
  # - "second_rules.yml"
  - "/etc/prometheus/*_rules.yml"

# A scrape configuration containing exactly one endpoint to scrape:
# Here it's Prometheus itself.
scrape_configs:
  # The job name is added as a label `job=<job_name>` to any timeseries scraped from this config.
  - job_name: "prometheus"
    static_configs:
      - targets: ["localhost:9090"]
  - job_name: "mysql-exporter"
    static_configs:
      - targets: ["10.0.0.201:31004"]
  - job_name: "node-exporter"
    static_configs:
      - targets: ["10.0.0.201:31003"]
  - job_name: "nginx-exporter"
    static_configs:
      - targets: ["10.0.0.201:31005"]

  - job_name: "tomcat-exporter"
    static_configs:
      - targets: ["10.0.0.1:8080"]

  - job_name: "es-exporter"
    static_configs:
      - targets: ["10.0.0.201:31006"]

  - job_name: "baimei-node-exporter"
    static_configs:
      - targets:
          - "10.0.0.205:9100"
          - "10.0.0.207:9100"
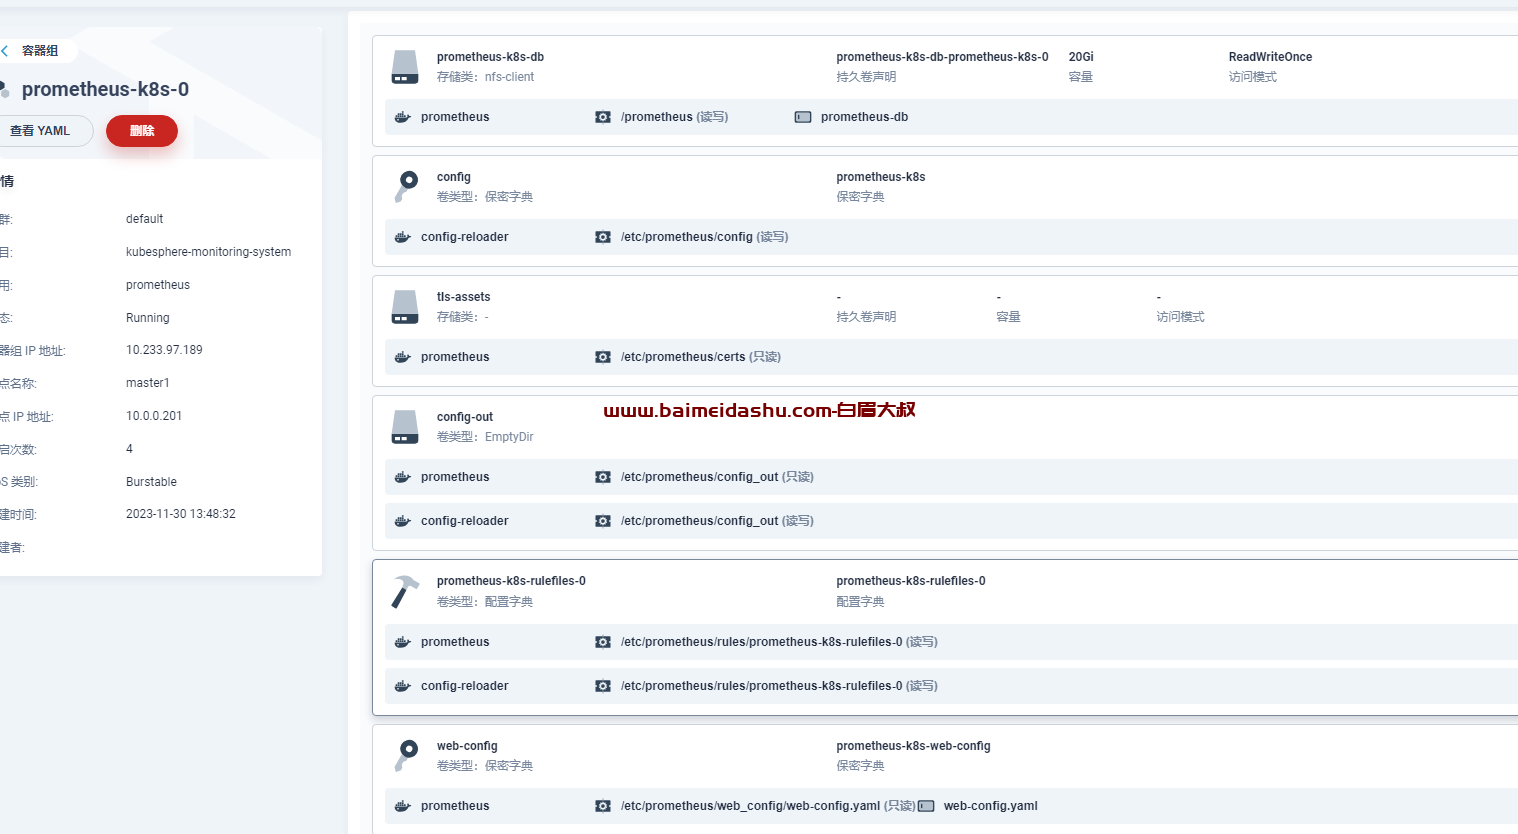
4- 配置 存储卷和配置字典
(1)prometheus.yml 配置 挂载
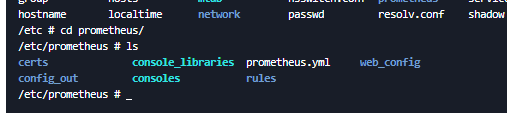
/etc/prometheus/prometheus.yml
prometheus.yml
(2)报警规则文件 配置
/etc/prometheus/mysql_rules.yml


mysql_rules.yml
(3) 存储卷
/prometheus
检测
http://10.0.0.201:31010/alerts

mysql_rules.yml
groups:
- name: MySQLStatsAlert
  rules:
  - alert: MySQL is down
    expr: mysql_up == 0
    for: 1m
    labels:
        severity: critical
    annotations:
        summary: "Instance {{ $labels.instance }} MySQL is down"
        description: "MySQL database is down. This requires immediate action!"

  - alert: Mysql_High_QPS
    expr: rate(mysql_global_status_questions[5m]) > 500
    for: 2m
    labels:
        severity: warning
    annotations:
        summary: "{{$labels.instance}}: Mysql_High_QPS detected"
        description: "{{$labels.instance}}: Mysql opreation is more than 500 per second ,(current value is: {{ $value }})"
  - alert: Mysql_Too_Many_Connections
    expr: rate(mysql_global_status_threads_connected[5m]) > 200
    for: 2m
    labels:
        severity: warning
    annotations:
        summary: "{{$labels.instance}}: Mysql Too Many Connections detected"
        description: "{{$labels.instance}}: Mysql Connections is more than 100 per second ,(current value is: {{ $value }})"

  - alert: Mysql_Too_Many_slow_queries
    expr: rate(mysql_global_status_slow_queries[5m]) > 3
    for: 2m
    labels:
        severity: warning
    annotations:
        summary: "{{$labels.instance}}: Mysql_Too_Many_slow_queries detected"
        description: "{{$labels.instance}}: Mysql slow_queries is more than 3 per second ,(current value is: {{ $value }})"

  - alert: SQL thread stopped
    expr: mysql_slave_status_slave_sql_running != 1
    for: 1m
    labels:
        severity: critical
    annotations:
        summary: "Instance {{ $labels.instance }} Sync Binlog is enabled"
        description: "SQL thread has stopped. This is usually because it cannot apply a SQL statement received from the master."
  - alert: Slave lagging behind Master
    expr: rate(mysql_slave_status_seconds_behind_master[5m]) >30
    for: 1m
    labels:
        severity: warning
    annotations:
        summary: "Instance {{ $labels.instance }} Slave lagging behind Master"
        description: "Slave is lagging behind Master. Please check if Slave threads are running and if there are some performance issues!"
参考点:
欢迎来撩 : 汇总all