1- 镜像
prom/mysqld-exporter:v0.15.1 #9104
2- 配置
.my.cnf
[client]
host=10.0.0.205
port=3306
user=root
password=baimeidashu

CREATE USER 'exporter'@'localhost' IDENTIFIED BY 'XXXXXXXX';
GRANT PROCESS, REPLICATION CLIENT ON *.* TO 'exporter'@'localhost';
GRANT SELECT ON performance_schema.* TO 'exporter'@'localhost';
配置mysql 报警规则:
mysql_rules.yml
groups:
- name: MySQLStatsAlert
  rules:
  - alert: MySQL is down
    expr: mysql_up == 0
    for: 1m
    labels:
        severity: critical
    annotations:
        summary: "Instance {{ $labels.instance }} MySQL is down"
        description: "MySQL database is down. This requires immediate action!"

  - alert: Mysql_High_QPS
    expr: rate(mysql_global_status_questions[5m]) > 500
    for: 2m
    labels:
        severity: warning
    annotations:
        summary: "{{$labels.instance}}: Mysql_High_QPS detected"
        description: "{{$labels.instance}}: Mysql opreation is more than 500 per second ,(current value is: {{ $value }})"
  - alert: Mysql_Too_Many_Connections
    expr: rate(mysql_global_status_threads_connected[5m]) > 200
    for: 2m
    labels:
        severity: warning
    annotations:
        summary: "{{$labels.instance}}: Mysql Too Many Connections detected"
        description: "{{$labels.instance}}: Mysql Connections is more than 100 per second ,(current value is: {{ $value }})"

  - alert: Mysql_Too_Many_slow_queries
    expr: rate(mysql_global_status_slow_queries[5m]) > 3
    for: 2m
    labels:
        severity: warning
    annotations:
        summary: "{{$labels.instance}}: Mysql_Too_Many_slow_queries detected"
        description: "{{$labels.instance}}: Mysql slow_queries is more than 3 per second ,(current value is: {{ $value }})"

  - alert: SQL thread stopped
    expr: mysql_slave_status_slave_sql_running != 1
    for: 1m
    labels:
        severity: critical
    annotations:
        summary: "Instance {{ $labels.instance }} Sync Binlog is enabled"
        description: "SQL thread has stopped. This is usually because it cannot apply a SQL statement received from the master."
  - alert: Slave lagging behind Master
    expr: rate(mysql_slave_status_seconds_behind_master[5m]) >30
    for: 1m
    labels:
        severity: warning
    annotations:
        summary: "Instance {{ $labels.instance }} Slave lagging behind Master"
        description: "Slave is lagging behind Master. Please check if Slave threads are running and if there are some performance issues!"
配置granfa
17320
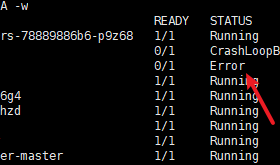
发现mysql 没有数据
检测:
开启 对外的mysql-exporter 端口
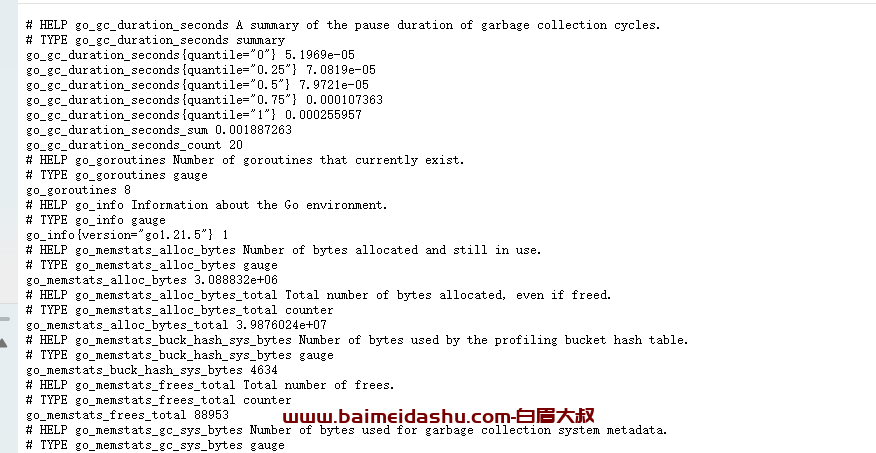
发现 数据是有的, 刷新后也会更新。
把mysql -exporter 停止后, 就没有数据了。 访问不了了。
奇怪的是,我在配置信息中 把密码故意改错,也能收到数据。
那么grafana 没数据的原因应该是 自己配置的问题 检查后,grafana 配置没有问题。
那么就看看prometheus 的配置
发现地址不对


欢迎来撩 : 汇总all