prometheus监控MySQL环境
思路就是 mysqld_exporter 登录 远程mysql 然后 采集数据, 传给 promtheus, 然后 在通过 grafana展示。
1- 安装 mysql:
mysql 8 yum 方式安装 : 连接
创建mysqld-exporter的授权用户 (只允许localhost)
CREATE USER 'mysql_exporter'@'localhost'  IDENTIFIED WITH mysql_native_password BY 'baimeidashu' WITH MAX_USER_CONNECTIONS 3;

GRANT PROCESS, REPLICATION CLIENT, SELECT ON *.* TO 'mysql_exporter'@'localhost';

quit
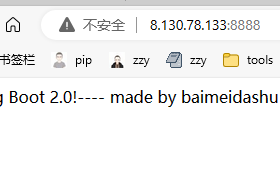
测试:
mysql -umysql_exporter -pbaimeidashu
2 部署myqld-exporter
1 下载mysqld-exporter
wget https://github.com/prometheus/mysqld_exporter/releases/download/v0.15.0/mysqld_exporter-0.15.0.linux-amd64.tar.gz2 解压软件包
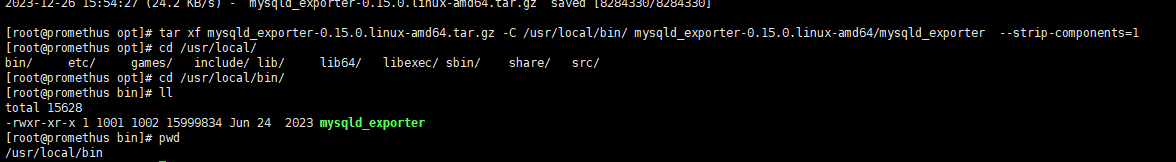
tar xf mysqld_exporter-0.15.0.linux-amd64.tar.gz -C /usr/local/bin/ mysqld_exporter-0.15.0.linux-amd64/mysqld_exporter --strip-components=1
3 创建MySQL的配置,指定默认的用户名和密码
cat >> /root/.my.cnf <<EOF
[client]
user=mysqld_exporter
password=baimeidashu

EOF
这里要注意 如果是监控的远程的mysql 就要配置一下
[client]
host=10.0.0.205
port=3306
user=mysql_exporter
password=baimeidashu
最好在mysqld-exporter 上测试一下通不通。
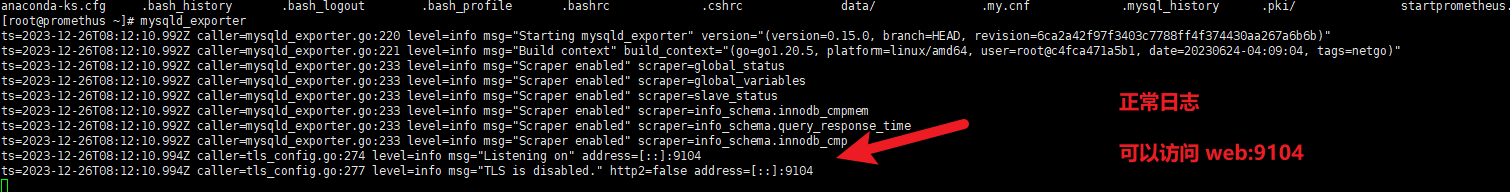
4 运行mysqld-exporter
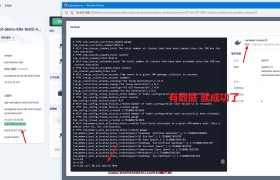
mysqld_exporter
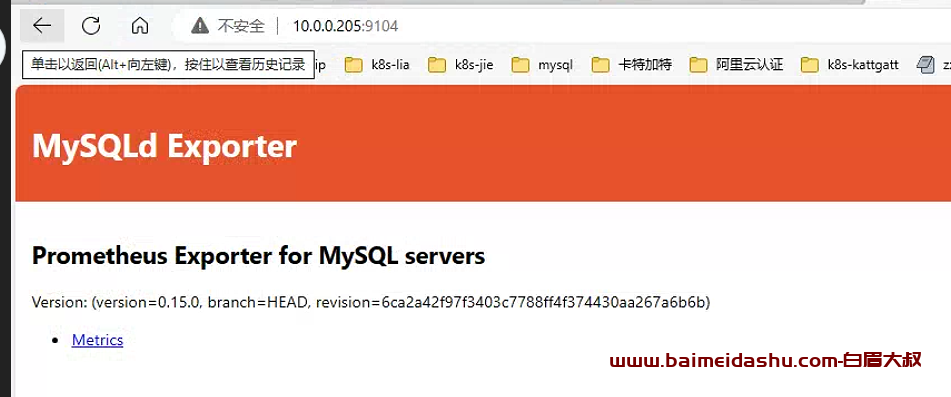
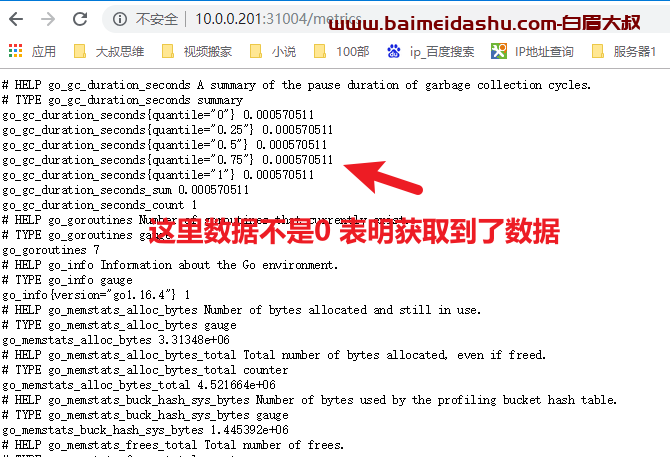
点击 metrices 跳转下图
3 配置prometheus采集mysqld_exporter数据
1 修改配置文件
添加
  - job_name: "mysql-exporter"
    static_configs:
      - targets: ["10.0.0.205:9104"]
参考:prometheus/mysqld_exporter: Exporter for MySQL server metrics (github.com)
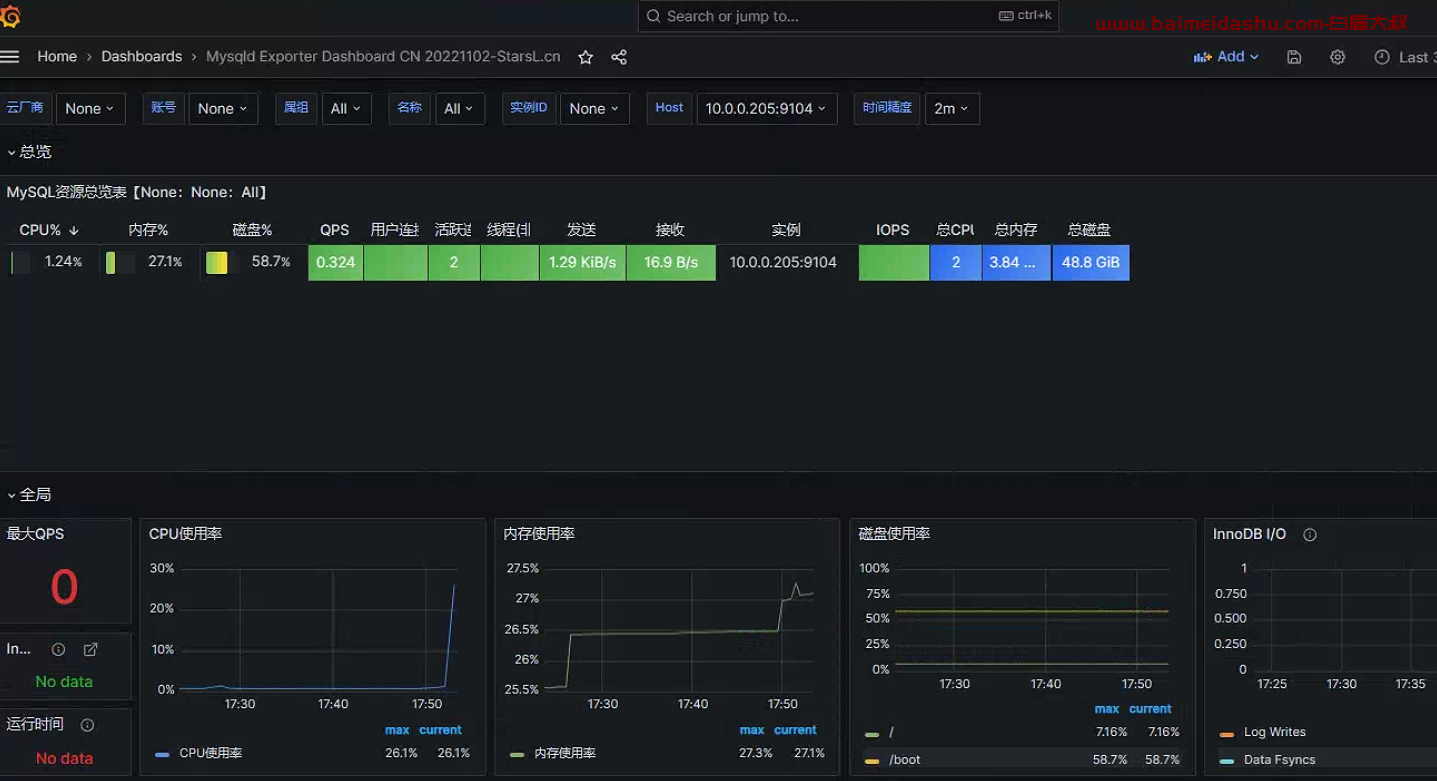
2-导入grafana的模板ID
17320
18949
这两个模版都可以试试
欢迎来撩 : 汇总all