containers:
- name: container-9o4qq6
image: 'prometheuscommunity/elasticsearch-exporter:v1.5.0'
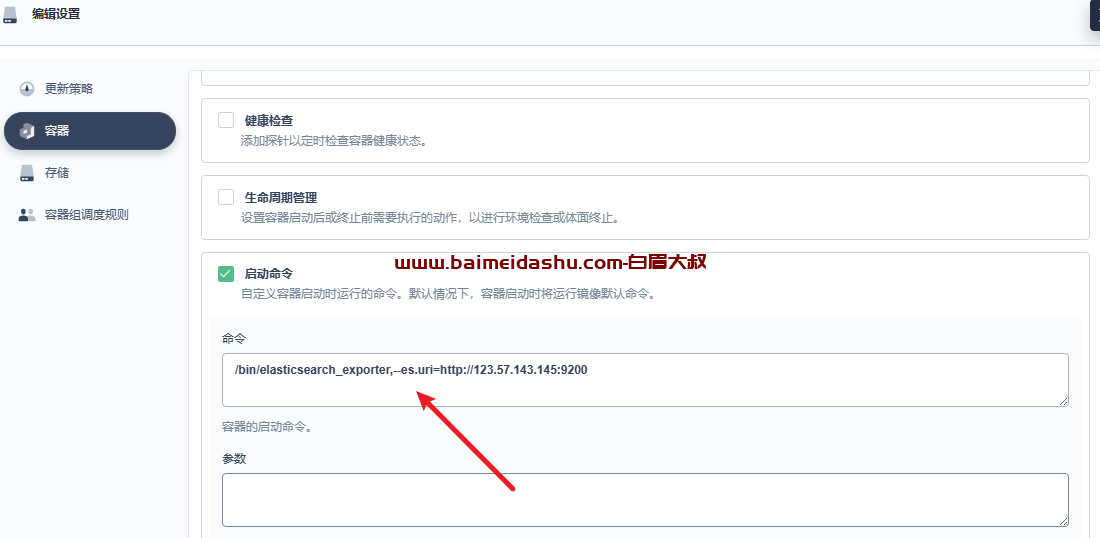
command:
- /bin/elasticsearch_exporter
- '--es.uri=http://123.57.143.145:9200'
1- 镜像
prometheuscommunity/elasticsearch-exporter:v1.5.0上边这个是没问题的,
但是下边的这个是有问题的, 不能配置自己的 es .
bitnami/elasticsearch-exporterbitnami/elasticsearch-exporter - Docker Image
2- 运行环境
elasticsearch_exporter --es.all --es.indices --es.cluster_settings --es.indices_settings --es.shards --es.snapshots --es.timeout=10s --web.listen-address=":9114" --web.telemetry-path="/metrics" --es.uri="http://123.57.143.145:9200/"
elasticsearch_exporter --help
3- 配置
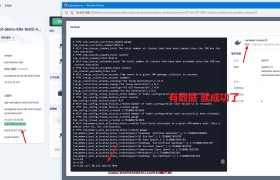
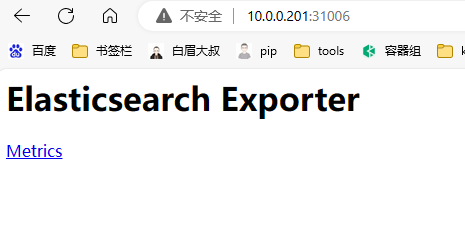
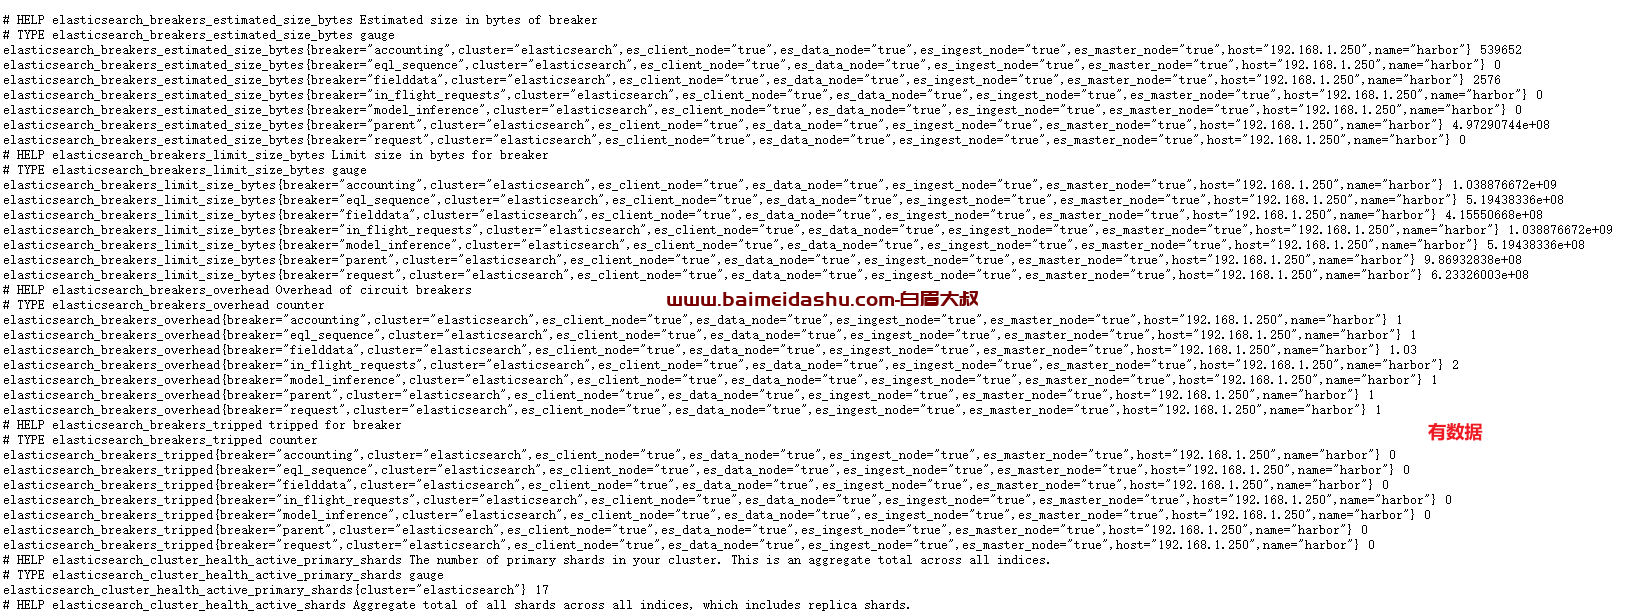
3-检测 metrics
http://10.0.0.201:31006/
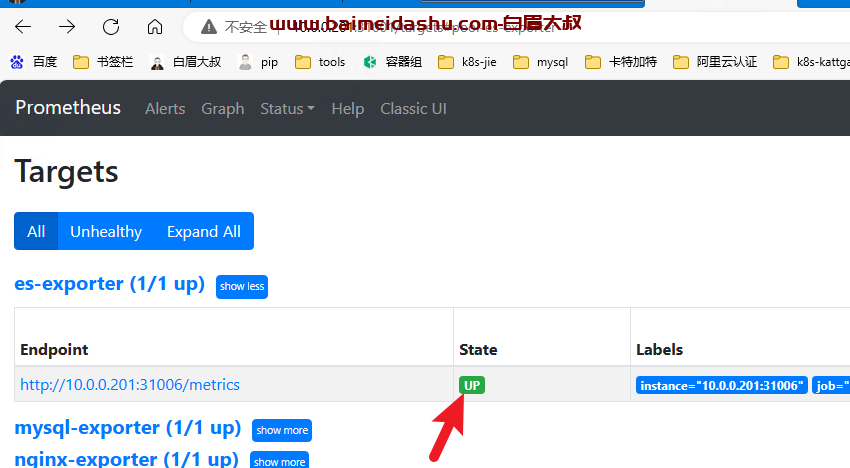
5- 配置 prometheus.yaml
  - job_name: "es-exporter"
    static_configs:
      - targets: ["10.0.0.201:31006"]
重启prometheus
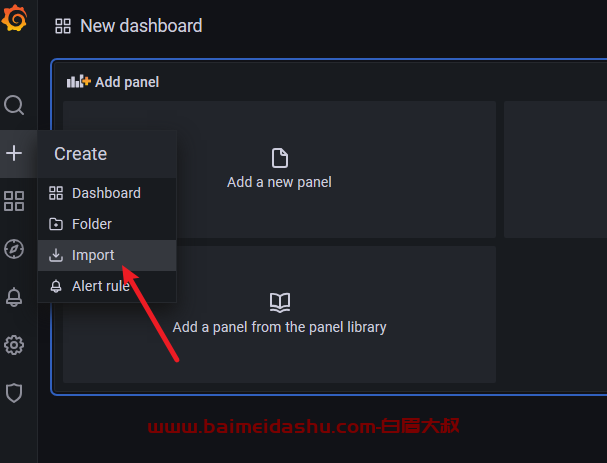
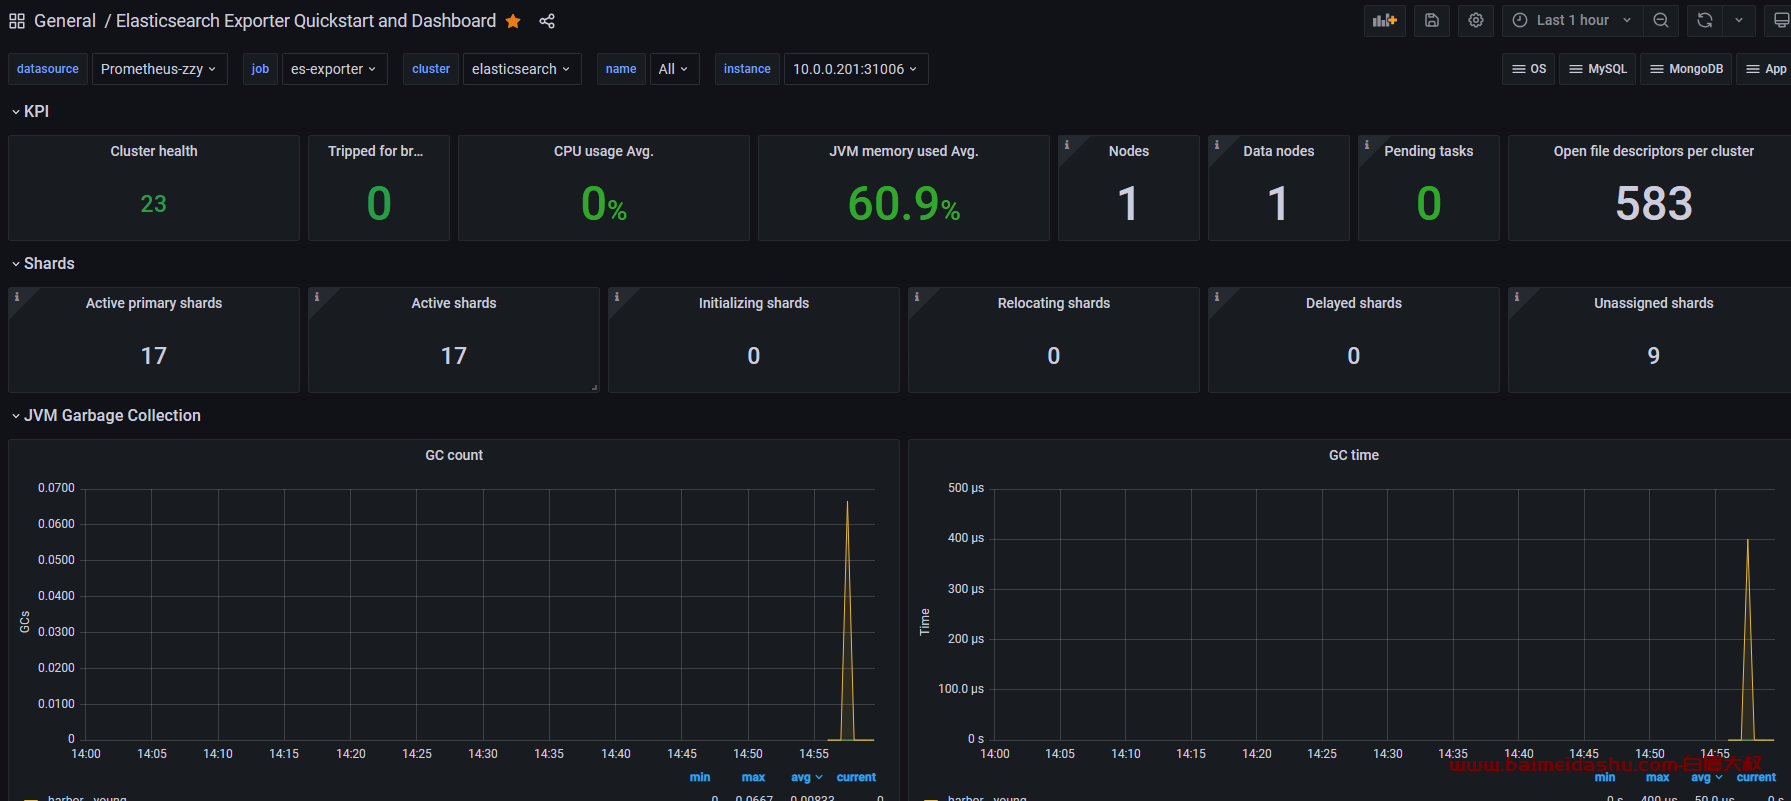
6- 配置 grafana
https://grafana.com/grafana/dashboards/14191-elasticsearch-overview/
14191
k8s容器中通过Prometheus Operator部署Elasticsearch Exporter监控Elasticsearch - 星空流年 - 博客园 (cnblogs.com)
欢迎来撩 : 汇总all